ViSizer: A Visualization Resizing Framework
Yingcai Wu1
Xiaotong Liu2
Shixia Liu1
Kwan-Liu Ma3
This project was conducted when Yingcai Wu worked in UC Davis.
1Microsoft Research Asia
2The Ohio State University
3University of California, Davis
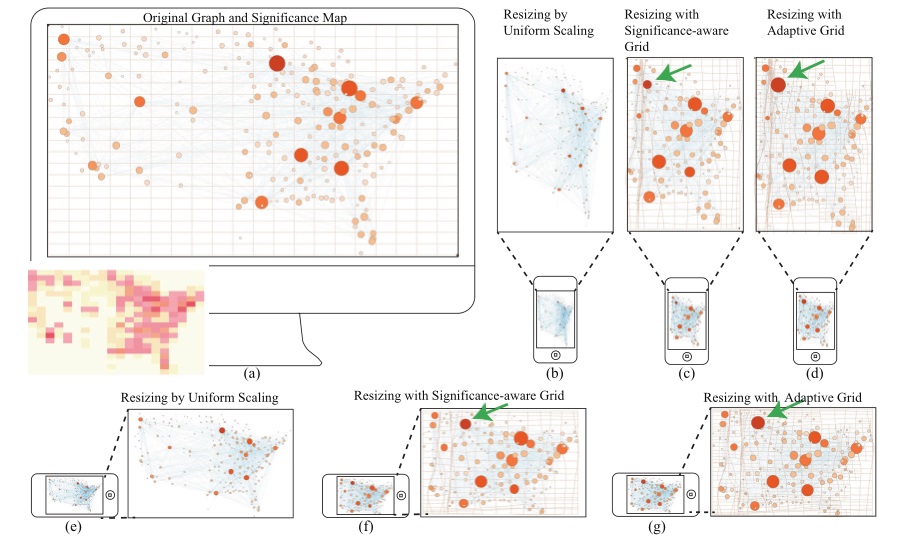
Visualization resizing is useful for many applications where users may use different display devices. General resizing techniques (e.g., uniform scaling) and image resizing techniques suffer from several drawbacks, as they do not consider the content of the visualizations. Thiswork introduces ViSizer, a perception-based framework for automatically resizing a visualization to fit any display. We formulate an energy function based on a perception model (feature congestion), which aims to determine the optimal deformation for every local region. We subsequently transform the problem into an optimization problem by the energy function. An efficient algorithm is introduced to iteratively solve the problem, allowing for automatic visualization resizing.
@article {YWu2013c,
author = {Yingcai Wu and Xiaotong Liu and Shixia Liu and Kwan-Liu Ma},
title = {ViSizer - A Visualization Resizing Framework,
journal = {IEEE Transactions on Visualization and Computer Graphics,
year = {2013},
volume = {19},
number = {2},
pages = {278--290}
}
This research was supported in part by the HP Labs and U.S. National Science Foundation through grants CCF-0808896, CNS-0716691, CCF 0811422, CCF 0938114, and CCF-1025269.