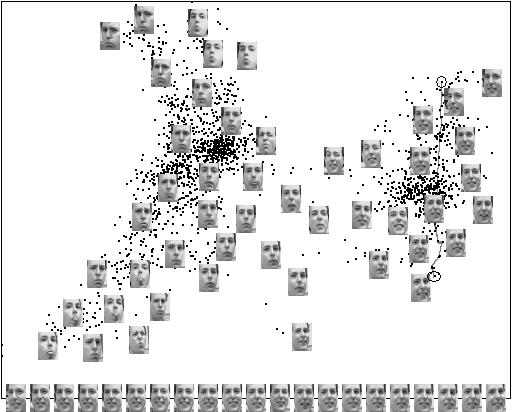
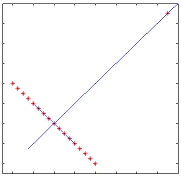
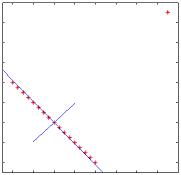
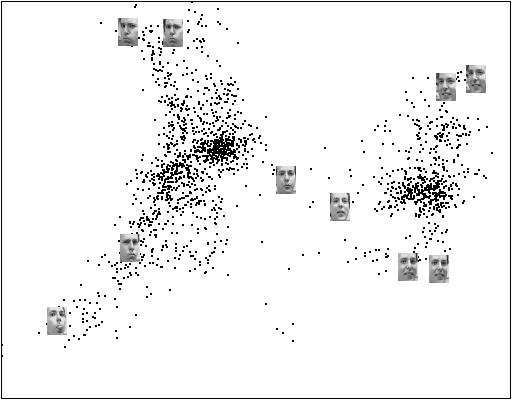
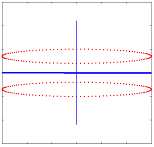
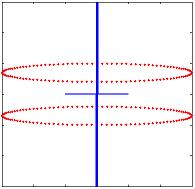
Locality Preserving Projections

Xiaofei He and Partha Niyogi

paper code


Locality Preserving Projections (LPP) are linear projective maps that arise by solving a variational problem that optimally preserves the neighborhood structure of the data set. LPP should be seen as an alternative to Principal Component Analysis (PCA) -- a classical linear technique that projects the data along the directions of maximal variance. When the high dimensional data lies on a low dimensional manifold embedded in the ambient space, the Locality Preserving Projections are obtained by finding the optimal linear approximations to the eigenfunctions of the Laplace Beltrami operator on the manifold. As a result, LPP shares many of the data representation properties of nonlinear techniques such as Laplacian Eigenmaps or Locally Linear Embedding. Yet LPP is linear and more crucially is defined everywhere in ambient space rather than just on the training data points. LPP may be conducted in the original space or in the reproducing kernel Hilbert space into which data points are mapped. This gives rise to kernel LPP.


Examples

1. Synthetic examples

PCA

LPP

PCA

LPP

The blue line segments describe the two bases. The first basis is shown as a longer line segment, and the second basis is shown as a shorter line segment. As can be seen, LPP has more discriminating power than PCA.

The blue line segments describe the two bases. The first basis is shown as a longer line segment, and the second basis is shown as a shorter line segment. Clearly, LPP is insensitive to the outlier at the right top corner.

2. Face manifold

Two dimensional linear embedding of face images by LPP. The bottom images correspond to points along the right path (linked by solid line), illustrating one particular mode of variability in pose.

The projection of 10 testing samples in the 2-D plane.

3. Handwritten Digit Manifold

A two-dimensional representation of the set of images of handwritten digits from MNIST database using LPP. As can be seen, the first dimension (horizontal axis) appears to describe the line thickness and the second dimension (vertical axis) appears to describe the slant.

The projection of 10 testing samples in the 2-D plane.